2 Data Set Comparison | Monthly Trend Line Animation
ByDescription
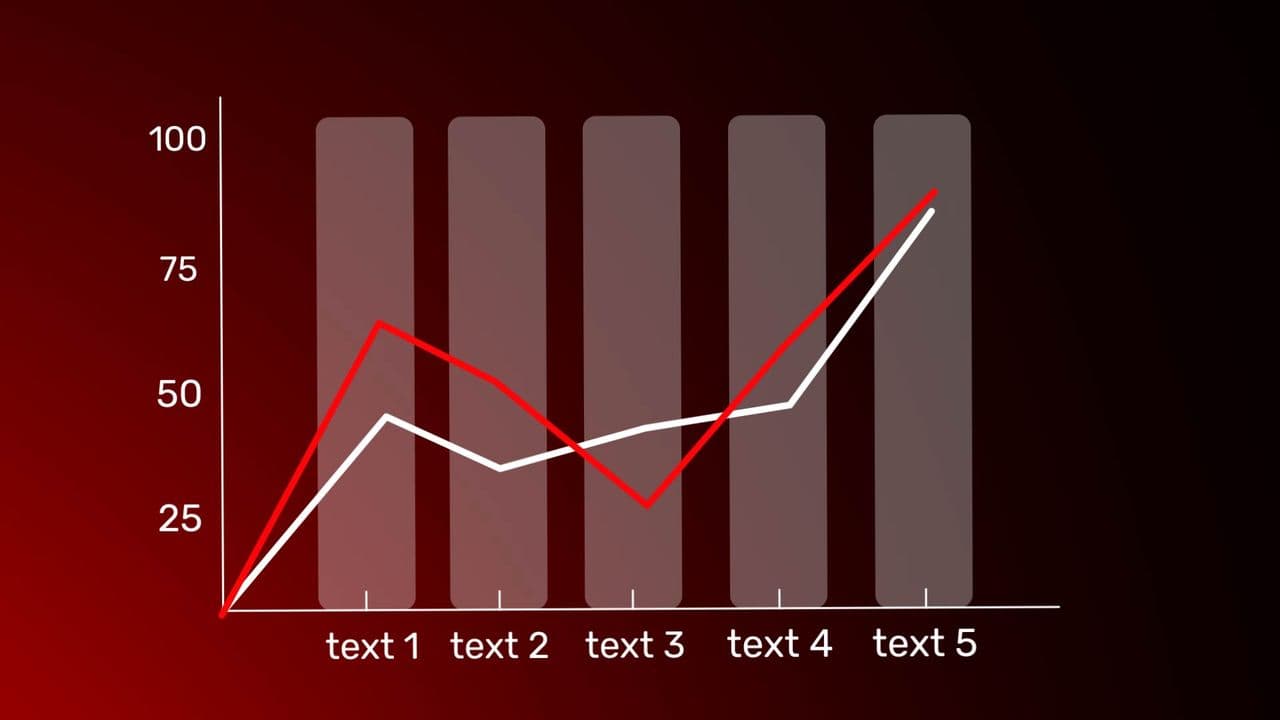
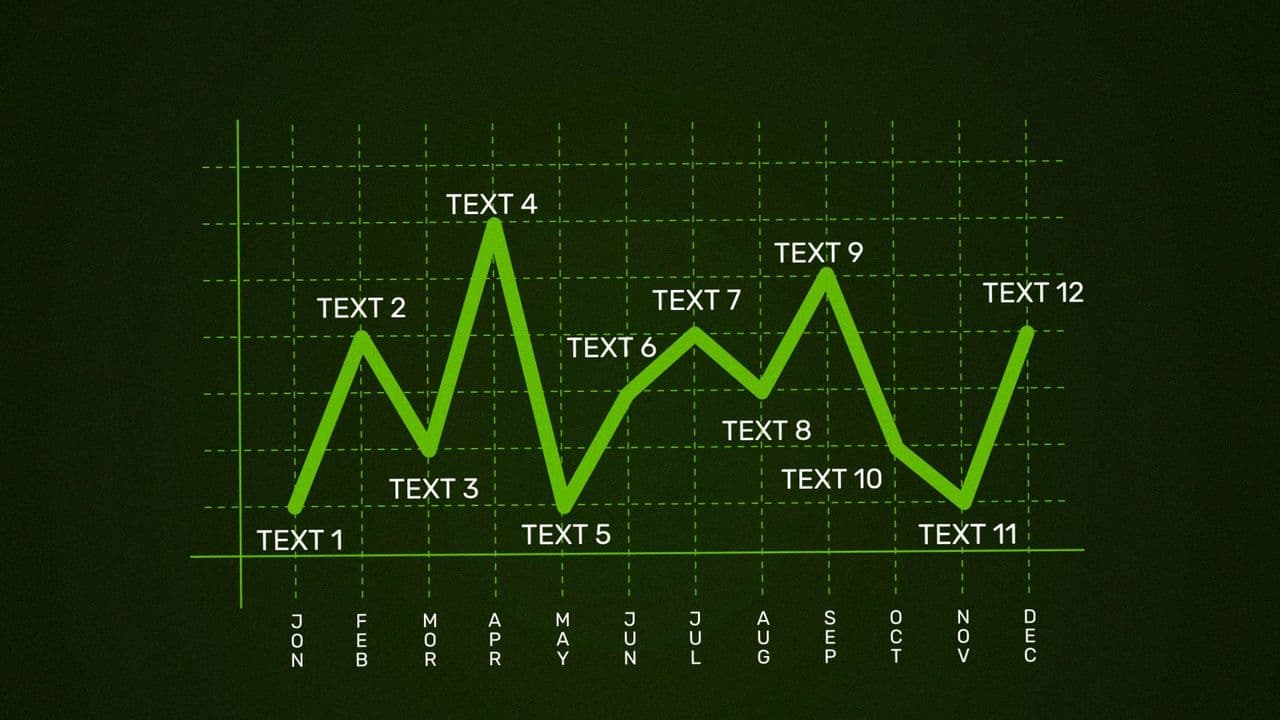
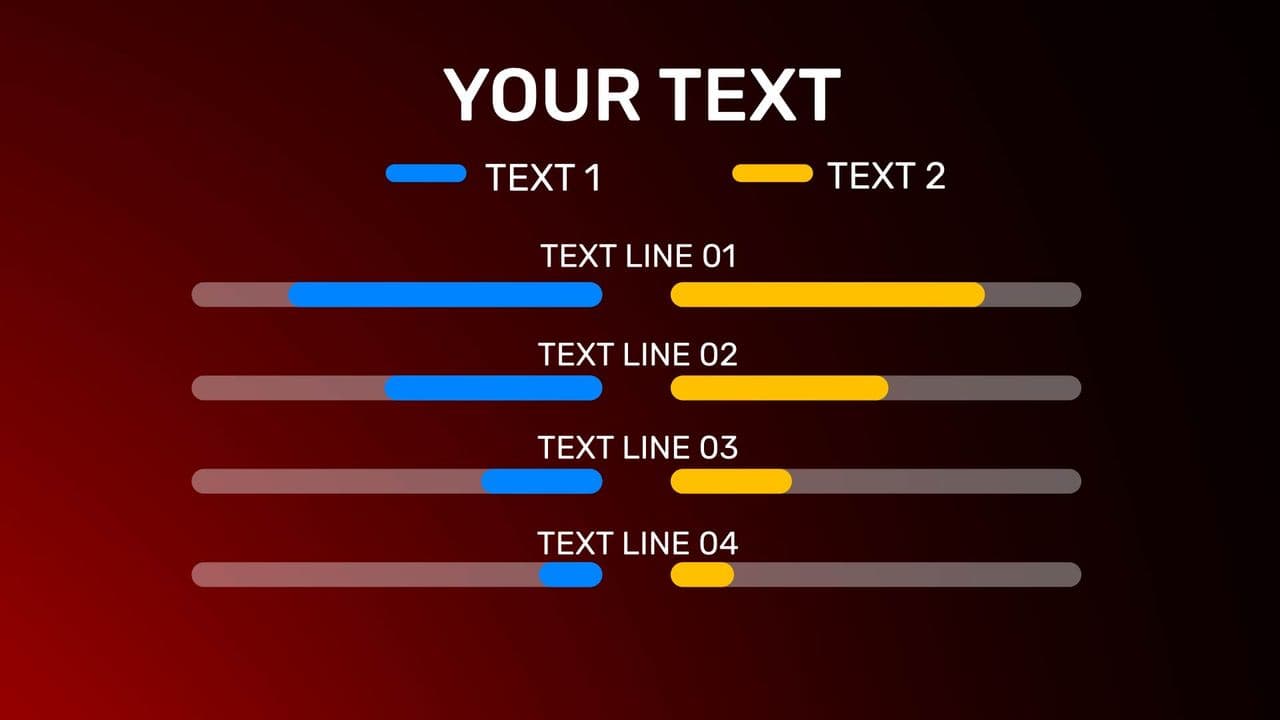
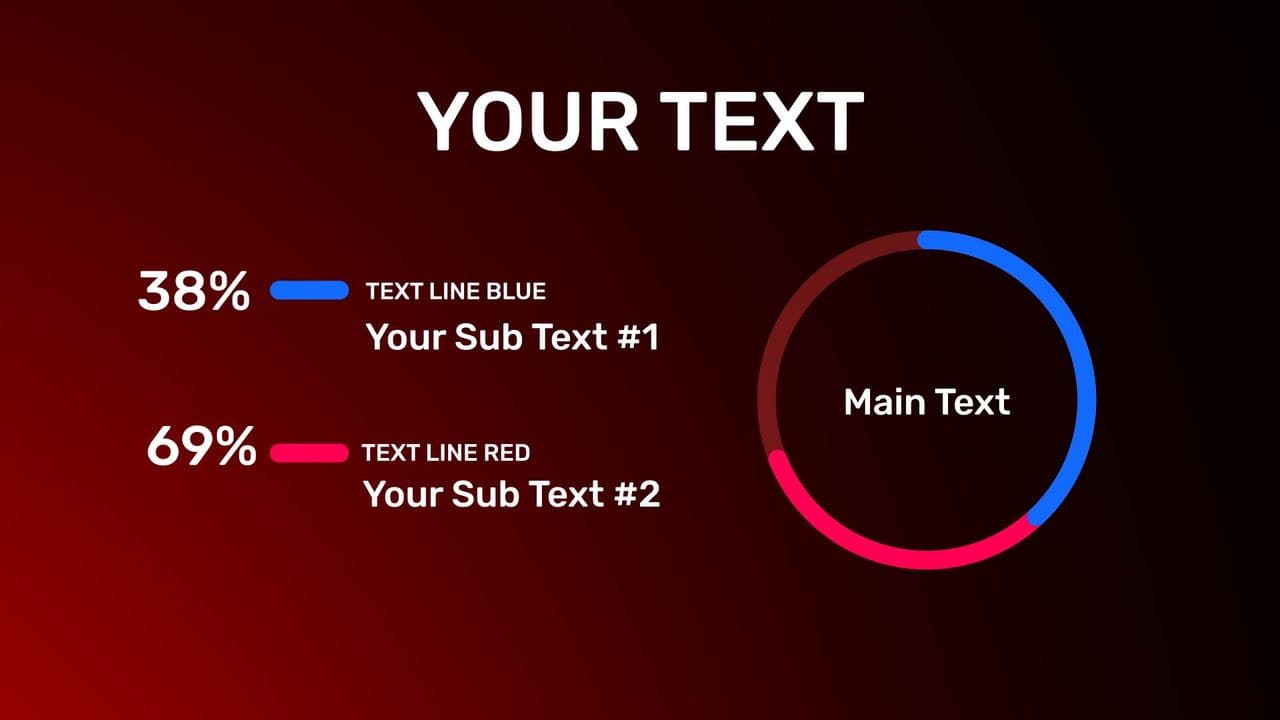
This dual-line animation clearly compares two sets of monthly data across a full year, perfect for highlighting trends, differences, and performance gaps. Each point supports custom text, ideal for showcasing KPIs, market growth vs. target, or brand A vs. brand B. Best used in segments like Comparative Presentation, Causal Relationship, or Dynamic Chart Animation. Perfect for business intros, result breakdowns, or financial summaries where clarity and contrast matter.
Details
10s
1920x1080
14 texts
1 image
Similar Animations

2-Line Trend Comparison Chart | Dual Data Animation with Soft Bars

Chart Comparison Animation | Data Drop vs Growth Highlight

Chart Comparison Animation | Data Drop vs Growth Highlight

12-Point Monthly Data Animation

Flat vs Exponential Growth Animation | Chart-Based Visual Comparison

Flat vs Exponential Growth Animation | Chart-Based Visual Comparison

Line Chart Animation with Highlighted Data Point | Trend Visualization

4 Dual-Bar Comparison Animation | Horizontal Data Split
More Hooks By Moeinedits

UI Selector Animation: Highlight from 1 Scrolling Text List

UI Selector Animation: Highlight from 1 Scrolling Text List

Documentary Map Animation: Pinpoint 3 Photo Locations

Documentary Map Animation: Pinpoint 3 Photo Locations

News Print Highlight Animation: Spotlight 1 Key Quote or Headline

News Print Highlight Animation: Spotlight 1 Key Quote or Headline

Character Success Story: Financial Reveal

Character Success Story: Financial Reveal
More Animated Flowchart Templates

Floating Phone + 3 Text Bars | Red Data Chart Reveal Animation

Growth Curve Reveal with Custom Text

Apple-Style Glass Animation | 3-Part Puzzle for Tech Concept Breakdown

5-Image Board Animation | Seamless Documentary-Style Photo Reveal

6-Step Process Animation | Clean & Structured Workflow Reveal

5-Point Line Chart Animation with Subtle Bar Background

Dual Segment Ring Chart Animation | 2-Part Data Breakdown
